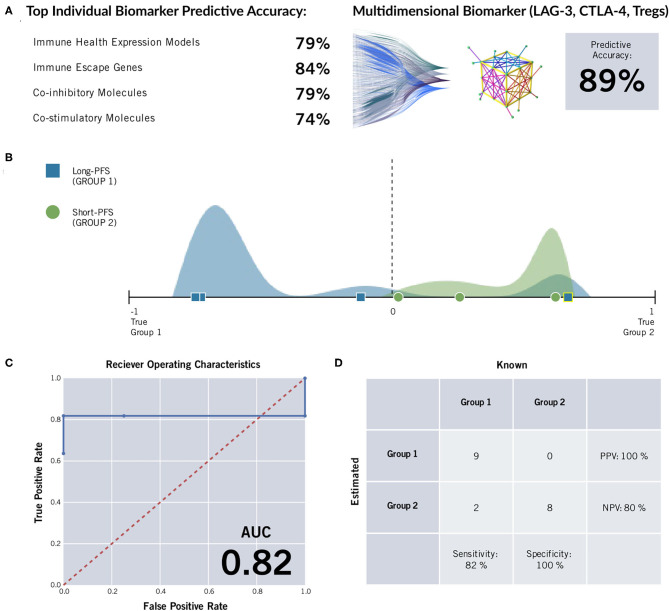
Figure 1.
ImmunoPrism® Multidimensional Biomarker Assessment of high grade serous ovarian cancer. (A) The most predictive marker from immune cell types (“immune health expression models”) and each type of immune gene were less accurate than a multidimensional biomarker comprising LAG-3, CTLA-4, and Tregs at predicting length of progression free survival. (B) The distributions of individual samples from both cohorts were evaluated for future performance using the multidimensional biomarker as the classifier. Multidimensional values are plotted along the x-axis, and the frequency of sample values are visualized in the vertical space. The sample distribution visualization is approximate. The cohorts are distinguished by color (green and blue) and shape (circle and square), and estimations are distinguished by outline color (white: correct estimation, yellow: incorrect estimation.) The dashed line at value = 0 indicates the prediction threshold that separates the cohorts. Samples that were incorrectly estimated are highlighted in yellow, and listed in Supplementary Table 2. (C) A Receiver Operating Characteristic (ROC) Curve was generated for the multidimensional biomarker. For various thresholds of the biomarker, the True Positive Rate (y-axis) is plotted against the False Positive Rate (x-axis). The area under the curve (AUC) is included in the lower right corner. The random predictor is shown as a dashed red line. (D) A confusion matrix was generated for the multidimensional biomarker. This matrix was used to calculate positive predictive value (PPV), negative predictive value (NPV), specificity, and sensitivity of the multidimensional biomarker by comparing how the samples are classified based on the assay (rows) vs. their known label based on clinical data (28). The incorrectly estimated samples are the same as those noted and labeled in the Multidimensional Biomarker Assessment.

