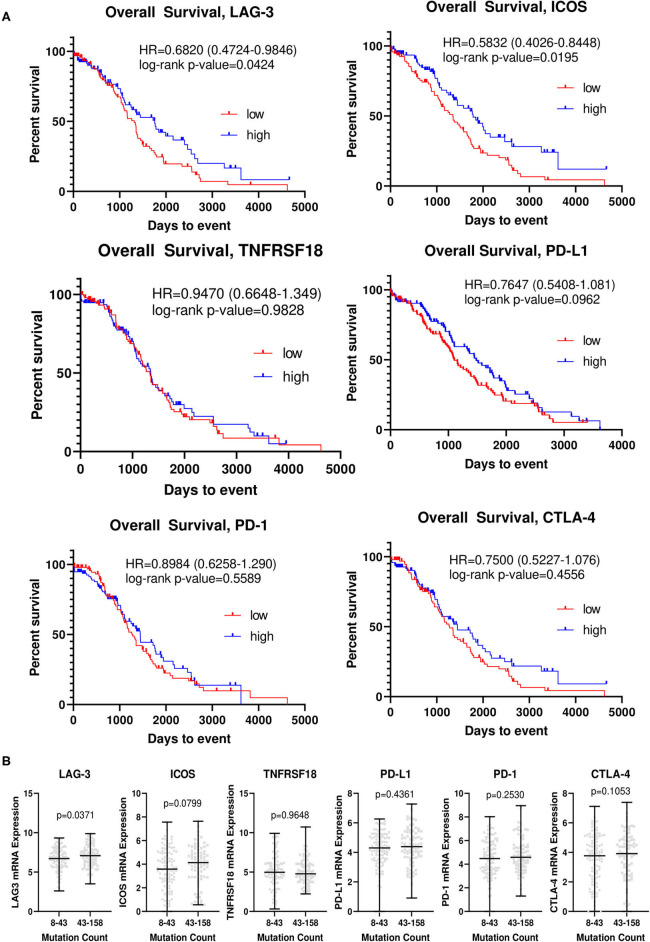
Figure 3.
LAG-3 and ICOS are associated with overall survival and mutation counts in The Cancer Genome Atlas ovarian cancer cohort. (A) Kaplan-Meier curves for LAG-3, ICOS, CTLA-4, PD-1, PD-L1, and TNFRSF18 were generated using TCGA-OV dataset. The top and bottom quartiles of expression (n = 95/group) were used to define “high” vs. “low” expressing groups. Log-rank hazard ratios (HR) and p-values are reported, with 95% confidence intervals in parentheses. (B) TCGA-OV dataset was separated into low (8–43) and high (43–158) mutation count groups by median mutation count. mRNA expression for each gene (RNA seq V2 RSEM) was determined for each group, with the black bar indicating median mRNA level for each group. P-value was determined by two-tailed, unpaired student t-test.

