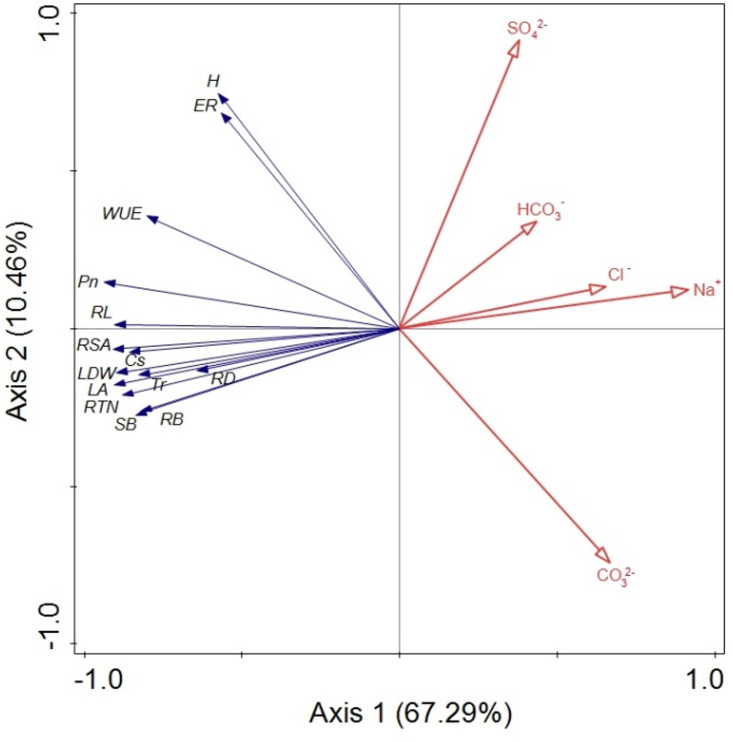
FIGURE 6.
Bioplot diagram of the redundancy analysis (RDA) on B. planiculmis constrained by Na+, Cl–, SO42–, HCO3–, and CO32–. ER, emergence rate; H, plant height; LA, leaf area; LDW, leaf dry weight; SB, shoot biomass; Pn, photosynthetic rate; Tr, transpiration rate; Gs, stomatal conductance; WUE, water use efficiency; RB, root biomass; RL, root length; RTN, root tip number; RSA, root surface area; RD, root average diameter. The total explained variance by all the selected soil variables is 79.7% (F = 55.3, p = 0.002). Axis 1 and axis 2 explained 67.3 and 10.5% of the variation, respectively, in the B. planiculmis seedlings.

