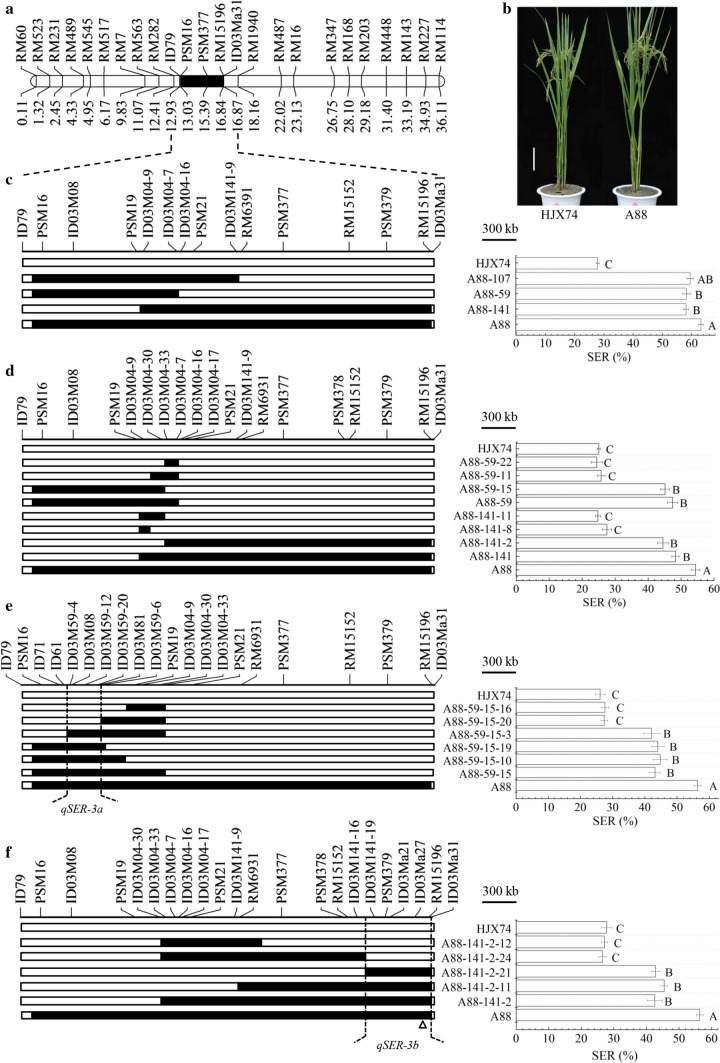
Fig. 3.
Substitution mapping of QTLs for SER on chromosome 3. a The substitution segment of SSSL-A88 on chromosome 3. Physical distance (Mb) was shown under the chromosome. b Plant type of HJX74 and SSSL-A88. Scale bar, 15 cm. c Secondary substitution mapping based on the substitution segment of SSSL-A88. d Secondary substitution mapping based on the substitution segment of A88-59 and A88-141, respectively. e Secondary substitution mapping of qSER-3a based on the substitution segment of A88-59-15. f Secondary substitution mapping of qSER-3b based on the substitution segment of A88-141-2. SER stigma exsertion rate. SER (%) was mean ± S.E. in two cropping seasons. Different alphabet letters denote differences at 0.01 level of significance in Duncan test. White and black blocks on chromosomes represent genotypes of HJX74 and donor, respectively. Δ, Location of GS3

