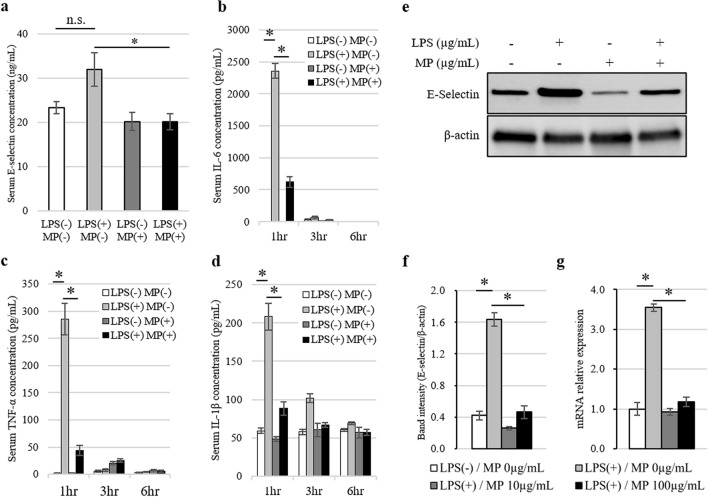
Figure 5.
Analysis of E-selectin expressed in the serum and portal vein following MP administration in an LPS-induced murine hepatic metastasis model. (a) ELISA analysis of serum E-selectin levels at 6 h after stimulation. Data are means ± standard error (n = 4, each group); *P < 0.05. n.s. no significance. (b–d) Analysis of serum cytokine levels at 1, 3, and 6 h after stimulation with LPS and MP. ELISA analysis of serum concentrations of IL-6 (b), TNF-α (c), and IL-1β (d). Data are means ± standard error (n = 4, each group); *P < 0.01. (e) Western blotting analysis of E-selectin protein expression levels in the portal vein at 6 h after stimulation. Blot was cut horizontally and immunoblotting was performed for each section. (f) Quantification of E-selectin band intensity normalized to β-actin. Data are means ± standard error (n = 3, each group); *P < 0.05. (g) Induction of Sele gene expression at 6 h after stimulation was analyzed by quantitative real-time PCR. Data are normalized relative to Actb mRNA levels. Data are means ± standard error (n = 4, each group); *P < 0.05.

