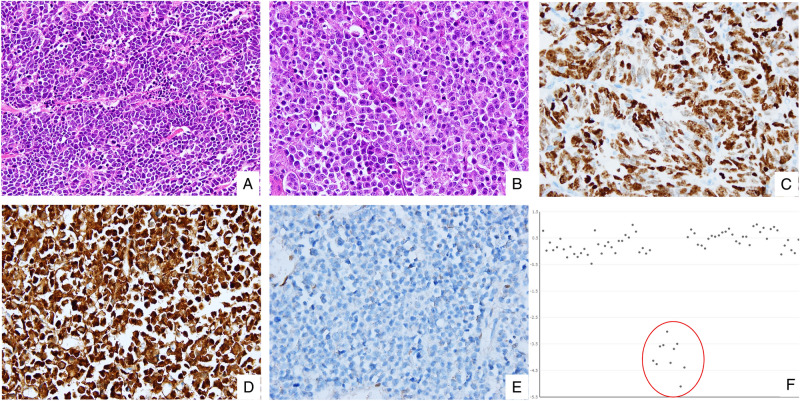
Figure 1.
Rb1/p16 pathway deregulation in colorectal NECs revealed by immunohistochemistry and next-generation sequencing. (A) Representative micrograph of small-cell NEC displaying small to medium sized cells with a high nuclear-cytoplasmic ratio, scant cytoplasm and frequent mitotic figures. (B) Representative micrograph of large-cell NEC showing large polygonal cells with prominent nucleoli and moderate amount of eosinophilic cytoplasm. (C) Intense and diffuse nuclear staining for p53. (D) Intense and diffuse cytoplasmic staining for p16. (E) Complete loss of Rb1 expression. (F) Deep deletion of RB1 on a normalized sequencing depth (red circle).

