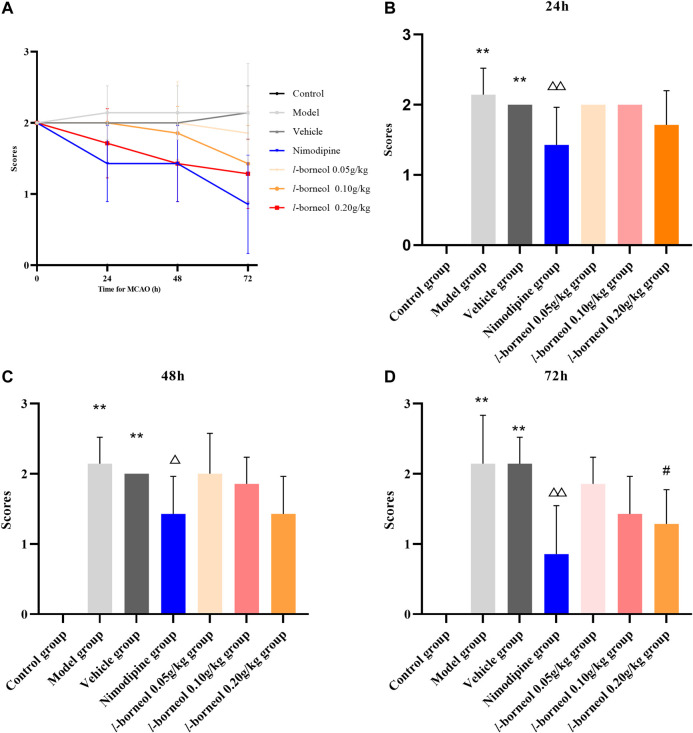
FIGURE 2.
Illustration of neurological function score using Zea–Longa methods (n = 6). (A) the trend after MCAO; (B) neurological function score after 24h; (C) neurological function score after 48h; (D) neurological function score after 72 h. ** p < 0.01, compared with the control group; △ p < 0.05, △△ p < 0.01, compared with the model group; # p < 0.05, compared with the vehicle group.

