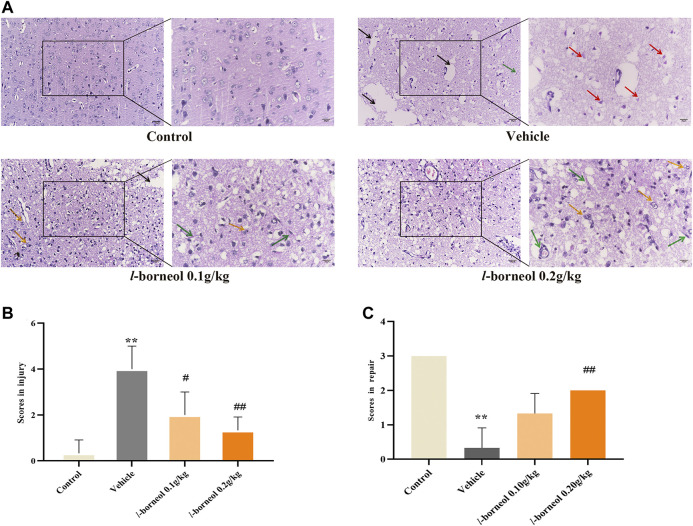
FIGURE 6.
Illustration of pathological changes using HE staining (n = 3). (A) HE results of each group, (B) Semi-quantitative analysis of pathological injury, (C) Semi-quantitative analysis of pathological repair. Red arrow represents red neuron, black arrow represents liquefied and necrotic nerve tissue, yellow arrow represents microglia clears out necrotic neurons, green arrows represents new blood vessels, ** p < 0.01, compared with the control group; # p < 0.05, ## p < 0.01, compared with the vehicle group.

