Figure 4.
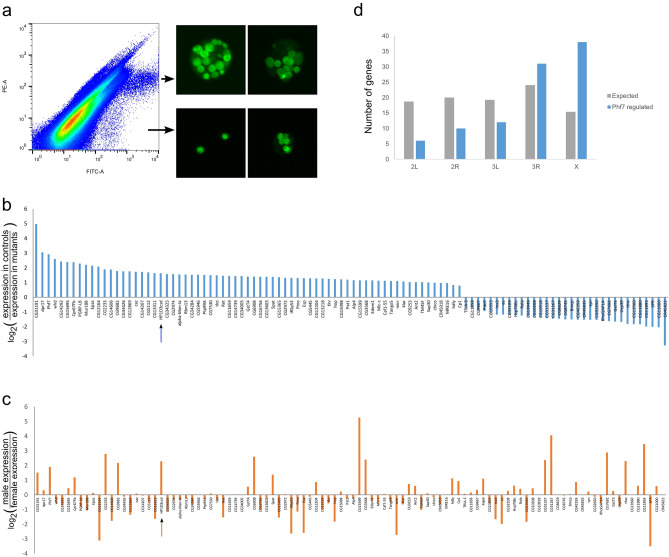
Transcriptome profiling of embryonic gonads with or without Phf7. (a), FACS plot of homogenate from vas-GFP late embryos. The GFP + particles are distributed in two patches, and representative images of gonads from each population are shown to the right of the FACS plot. Gonads from the upper population are more intact and were collected for RNA-seq. (b), Genes whose expression are significantly changed by the Phf7 mutation are plotted. The y-axis is the log-2 value of the expression ratio of control to mutant. HP1D3csd is indicated with an arrow. (c), Sex-expression ratio of Phf7-regulated genes in bam-mutant adult testis versus ovary based on another study29. HP1D3csd is indicated with an arrow. (d), Distribution of Phf7-regulated genes across different major fruit fly chromosomes. Gray bars are the expected number of genes on that chromosome based on their relative numbers of genes; blue bars represent distribution of Phf7-regulated embryonic targets. The observed distribution is significantly different from the expected one based on chi-squared analysis (P < 0.001).

