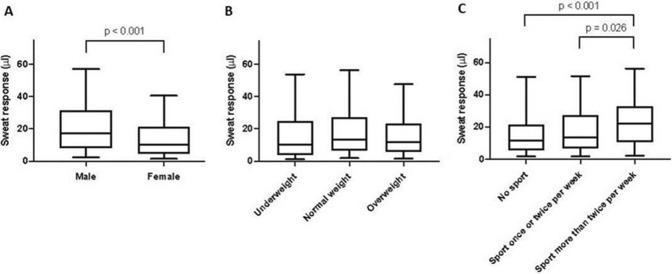
Figure 1.
Sweat response in an unadjusted comparison. Box-and-Whisker plots showing the unadjusted difference in sweat response between male and female subjects (panel 1A), across different BMI categories (panel 1 B) and across exercise categories (panel 1C). The boxes show the medians and quartiles, while the whiskers extend from the 5th to the 95th percentile. p values are based on Mann–Whitney U tests, with Bonferroni correction for post-hoc comparisons in Panel C.

