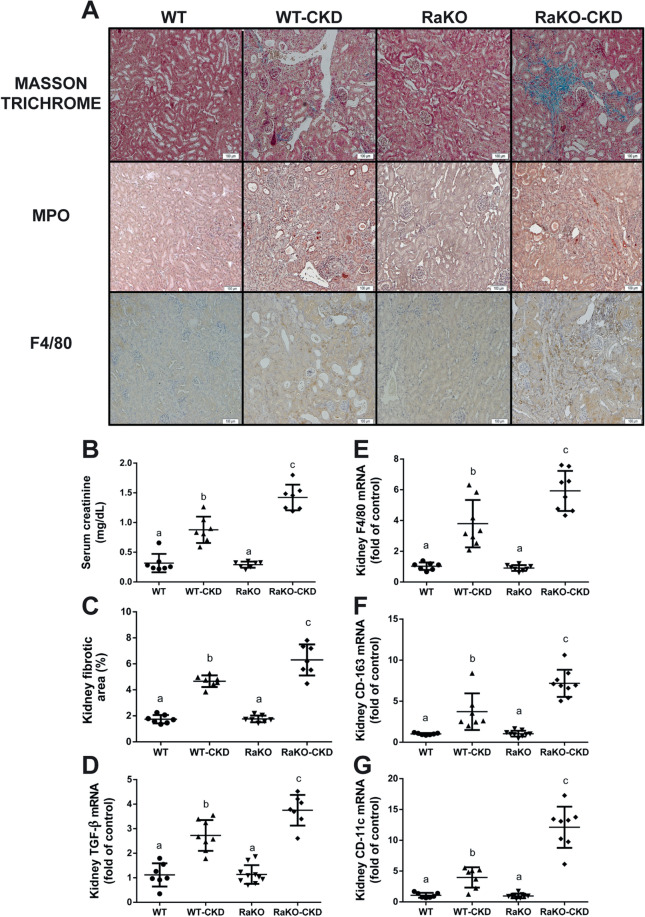
Figure 1.
Renal phenotype and fibrosis of CKD mice with uncontrolled IL1 expression. Experimental groups include: wild type mice on a regular (WT) or adenine diet (WT-CKD), IL1-R antagonist knockout mice on regular diet (RaKO) or adenine (RaKO-CKD). Representative kidney section (A). Upper row: Masson Trichrome staining; Middle row: immunohistochemical (IHC) staining for neutrophils (Myeloperoxidase—MPO); Lower row: IHC staining for macrophages (F4/80). Bar = 100 μm. Serum creatinine (mg/dL) (B). Kidney fibrotic area percentage as determined by the extent of Masson Trichome staining, analyzed with the ImageJ software (C). Kidney TGF-β mRNA levels (D). Kidney F4/80 (E), CD-163 (F) and CD-11c (G) mRNA levels. n = 6–10 per group. Different letters above bars indicate a significant difference between groups, similar letters indicate no significant difference.

