Figure 1.
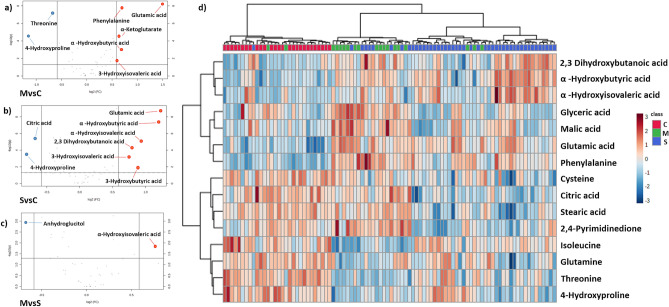
Changes in serum metabolites of controls vs COVID-19 patients. Volcano plots of metabolites that increase (red) or decrease (blue) in (a) mild COVID-19 versus controls, (b) severe COVID-19 vs controls and (c) severe versus mild COVID-19. Cut off fold change > 0.5, p value < 0.05. (d) Heatmap visualization and clustering analysis of differential metabolites among controls (C), mild (M) and severe (S) COVID-19 patients. Only the 15 metabolites with the lowest p values (by ANOVA) are shown.

