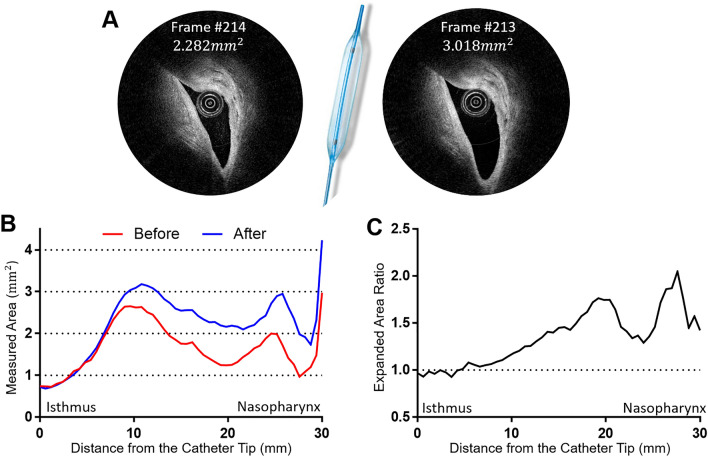
Figure 6.
Changes in the luminal area before and after balloon dilatation of the Eustachian tube. The cross-sectional area was calculated by converting the pixels (per inch) into areas (mm2). The areas of the same location were compared before and after balloon dilatation. In the mid-portion of the Eustachian tube (B), the luminal area increased from 2.282 to 3.018 mm2 (A). The widest luminal area was measured at around 10 mm inferior from the isthmus (B). The luminal area ratio before and after balloon dilatation tended to increase as it moved toward the nasopharyngeal opening of the Eustachian tube (C). The a, b, c, and d in (B) indicate corresponding locations presented in Fig. 5.

