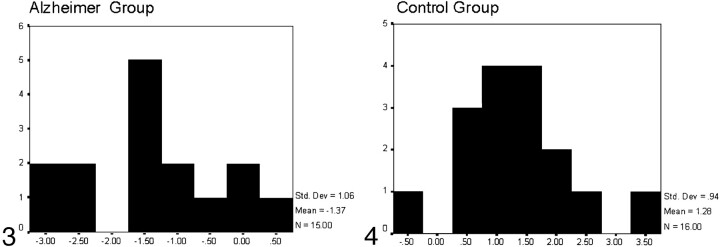
Fig 3.
Histogram representing the results of the discriminant analysis for the Alzheimer group: x axis reflects canonical scores, and y axis reflects the number of subjects who obtained every canonical score. Those with canonical scores below zero were classified as belonging to the AD group; three controls were incorrectly classified within the AD group.

