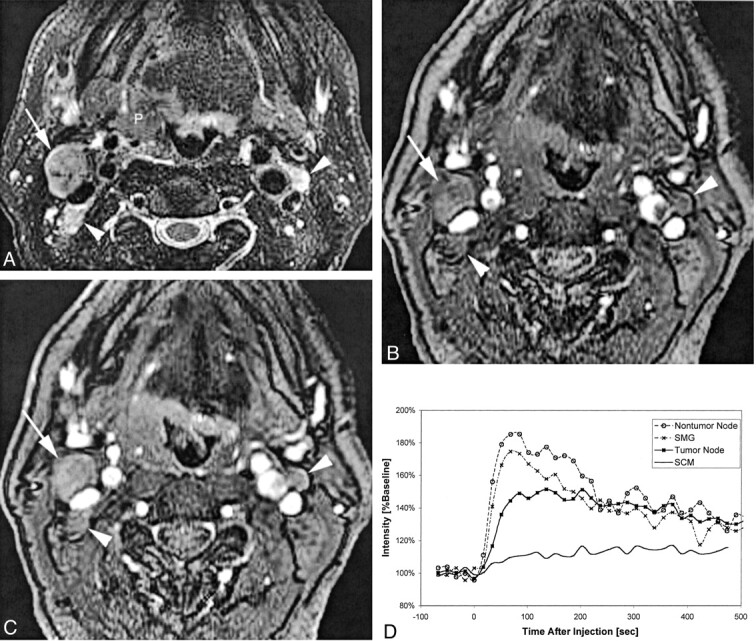
Fig 3.

Patient 6, a 57-year-old man with right oropharyngeal cancer and multiple palpable nodes who underwent pharyngectomy, right modified radical neck dissection, and left supraomohyoid neck dissection.
A, Coil-corrected fast spin-echo T2-weighted image with fat saturation (4000/90/4) shows the primary tumor (P), a dominant tumor-involved right level IIA node (white arrow), and two smaller tumor-involved level IIA lymph nodes (white arrowheads) on the right and left sides of the neck.
B, Baseline image (10.4/2.3; flip angle, 30 degrees) from the dynamic sequence shows the same tumor-involved nodes 117 seconds after contrast medium injection.
C, Enhanced dynamic image (10.4/2.3; flip angle, 30 degrees) shows the same tumor-involved nodes.
D, Plot of signal intensity versus time after injection of contrast agent, generated from regions of interest placed on the right level IIA tumor-involved node, a left level III non-tumor-involved node (not included on these images), the submandibular gland (SMG), and the sternocleidomastoid muscle (SCM). The different curve morphologies generated from these different tissues can be appreciated as shown by this comparison plot.
