
Fig 5.
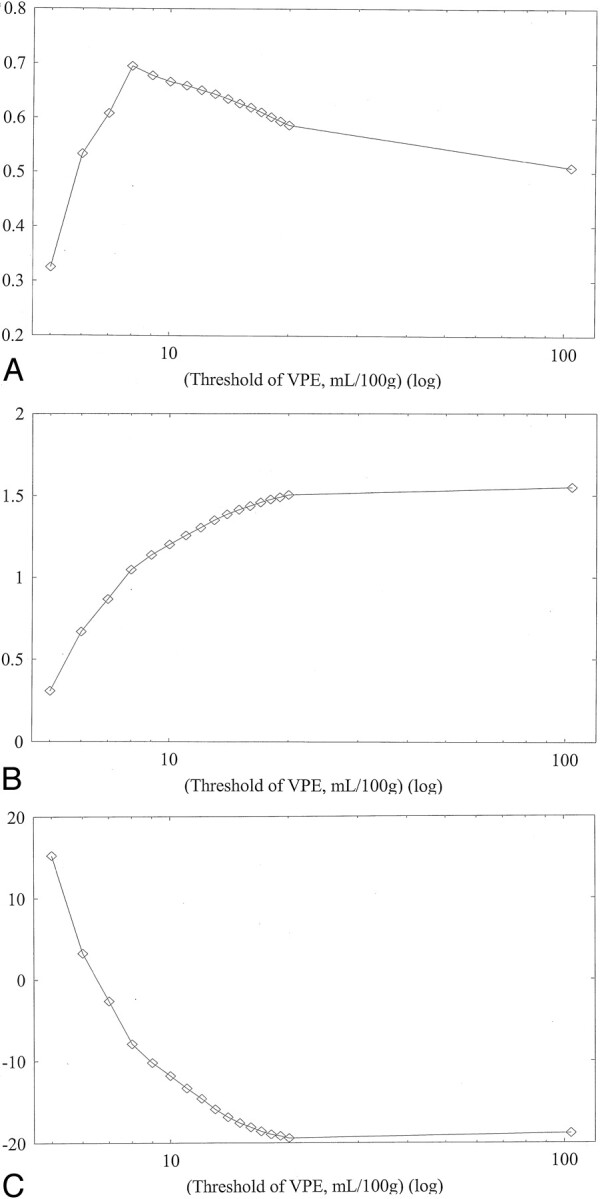
Results of linear regression analysis obtained in subject 1 against various VPE thresholds. Values without VPE are plotted at the most right-hand side (threshold of 104 mL/100 g).
A, Correlation coefficient. As the VPE threshold decreases, the correlation coefficient increases. The best correlation is observed at a VPE threshold of 8 mL/100 g. Note that correlation coefficients rapidly decrease when VPE threshold is less than 8 mL/100 g.
B, Slope of linear regression. As the VPE threshold decreases, the slope also decreases and approaches 1.0. When the VPE threshold is less than 8 mL/100 g, the slope becomes less than 1.0.
C, Intercept of linear regression. As the VPE threshold decreases, the intercept increases and approaches zero.