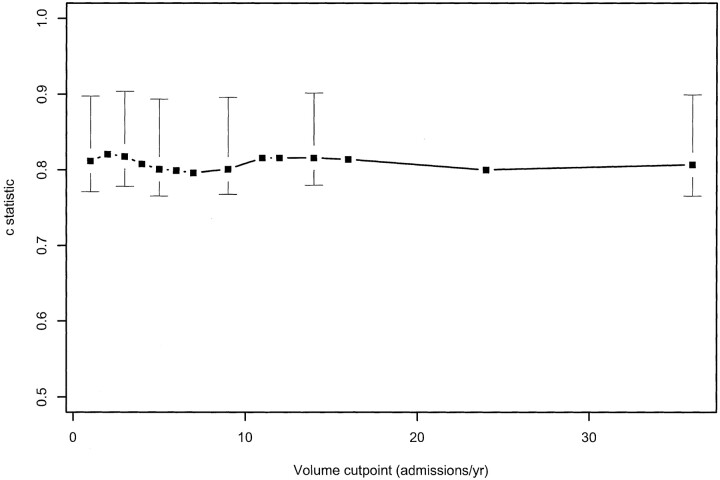
Fig 3.
c statistic (a generalization of the area under the receiver operating characteristic curve for ordinal models) plotted against cutoff points to divide high volume providers from low volume providers. The c statistic for all possible cutoff points is within the 95% confidence interval for the best cutoff point, indicating that the data fail to support a unique caseload value under which patient outcomes are evidently inferior.

