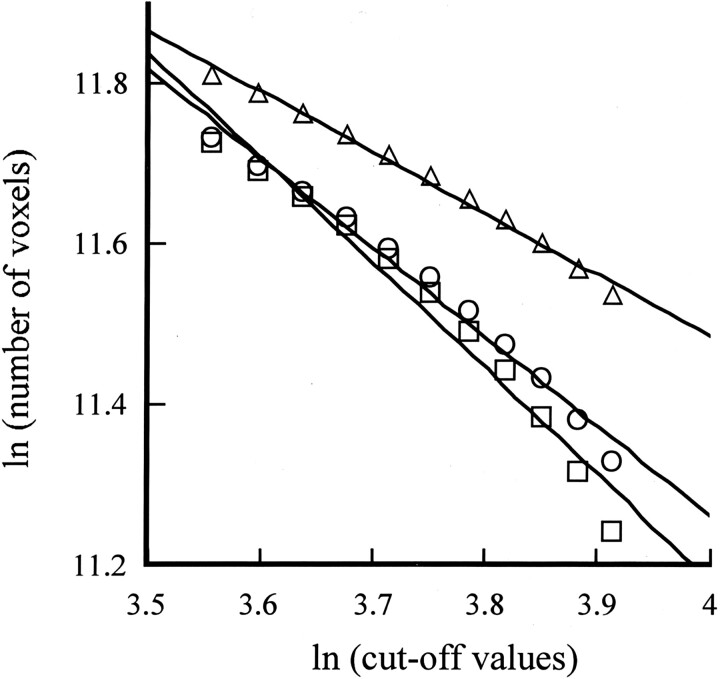
Fig 1.
Method for calculating the fractal dimension in one representative case each from the AD group, the VaD group, and the control group. □ indicates AD patient (y = −1.32x + 16.46; r = 0.994); ○ indicates VaD patient (y = −1.112x + 15.71; r = 0.992); ▵ indicates age-matched control (y = −0.767x + 14.55; r = 0.996)

