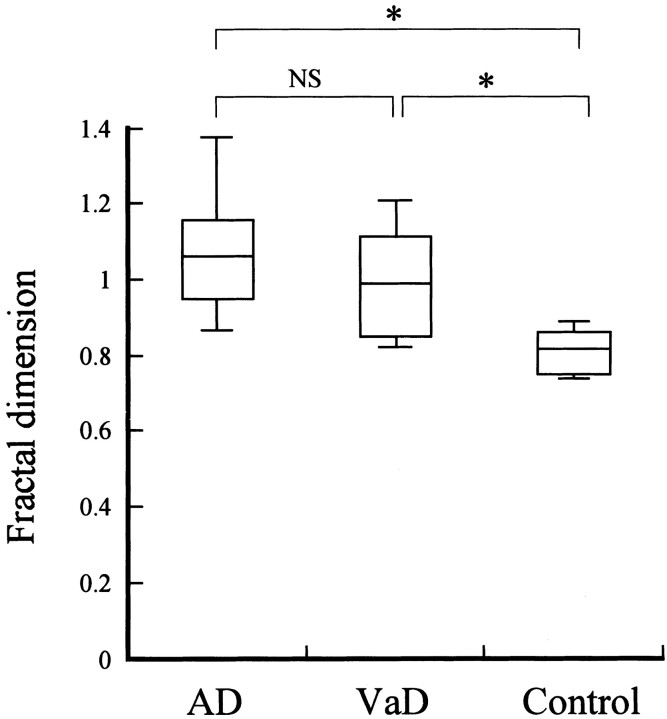
Fig 3.
Comparison of fractal dimensions among the AD, VaD, and control groups. Statistical analysis by the Mann-Whitney U test showed significant differences (*P < .0001) between the control group and the AD group, as well as between the control group and the VaD group. However, no significant difference (NS) was noted between the AD group and the VaD group

