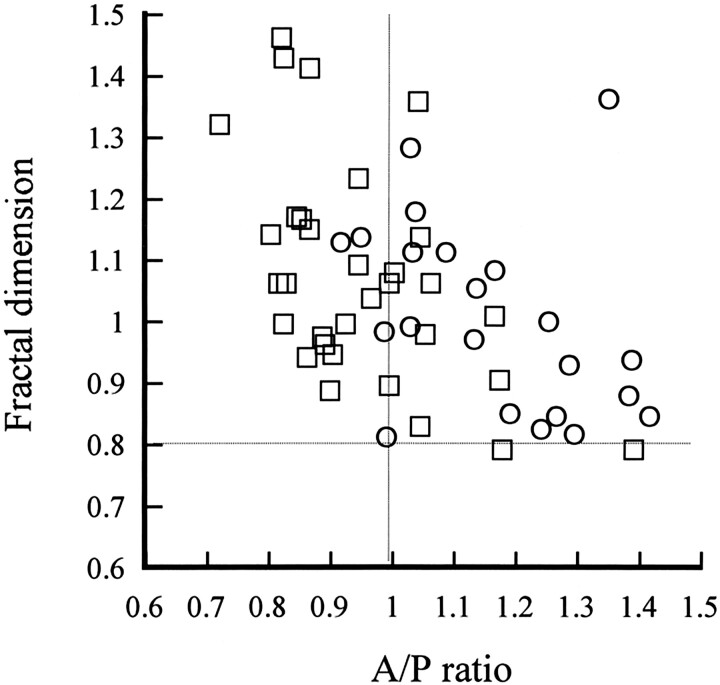
Fig 5.
Relationship between the fractal dimension and the A/P ratio in the AD group and the VaD group. Horizontal line is mean fractal dimension of 0.806 for the control group; vertical line is A/P ratio of 1. Examination of individual cases of AD and VaD showed that these diseases tended to be separated by an A/P ratio of 1. □ indicates AD patients (n = 32); ○, VaD patients (n = 22)

