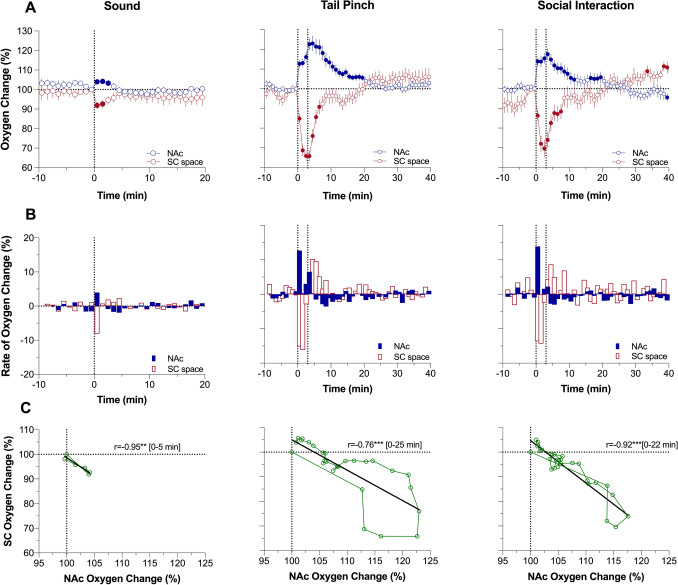
Figure 1.
Relationship between changes in oxygen levels in the nucleus accumbens (NAc) and subcutaneous (SC) space induced by auditory stimulus (Sound), Tail-pinch and Social Interaction in awake, freely moving rats. Slow time-course analysis. (A) Mean (± SEM) changes in oxygen levels relative to baseline (100%) calculated with 1-min time bins. Vertical hatched lines show onset and offset of stimulus presentation. Filled symbols mark values significantly different from pre-stimulus baseline (P < 0.05). (B) Rate of oxygen changes. (C) Correlative relationships between oxygen changes in two recording locations. r = coefficient of correlation calculated for the time interval of significant increase in NAc oxygen levels. Asterisks show significance of coefficients of correlation (** and ***, P < 0.01 and 0.001, respectively). Data were obtained in 6 rats; the numbers of averaged responses in each group are 9–16 (see Table for ANOVA values and n in each group in Supplementary materials).

