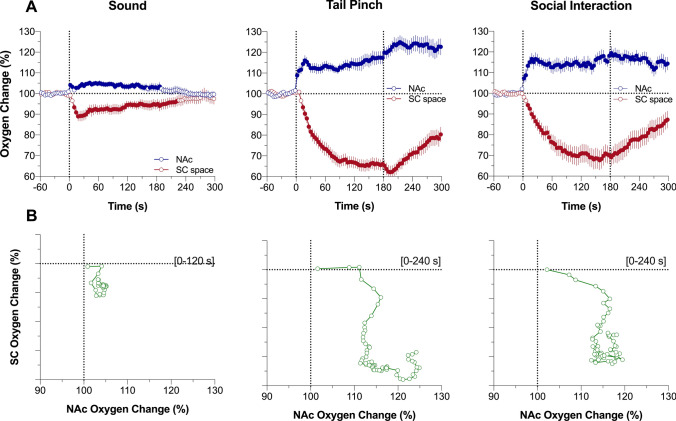
Figure 2.
Rapid time-course analysis of relationships between changes in oxygen levels in the nucleus accumbens (NAc) and subcutaneous (SC) space induced by arousing stimuli in awake, freely moving rats. (A) Mean (± SEM) changes in oxygen levels relative to baseline (100%) calculated with 4-s time bins. Vertical hatched lines show onset and offset of stimulus presentation. Filled symbols mark values significantly different from pre-stimulus baseline (P < 0.05). (B) Correlative relationships between oxygen changes in two recording locations shown for the time interval between the stimulus onset and maximal oxygen increase (duration of this interval is shown in brackets). Data were obtained in 6 rats; the numbers of averaged responses and F values of one-way repeated measure ANOVAs are shown in Supplementary materials.

