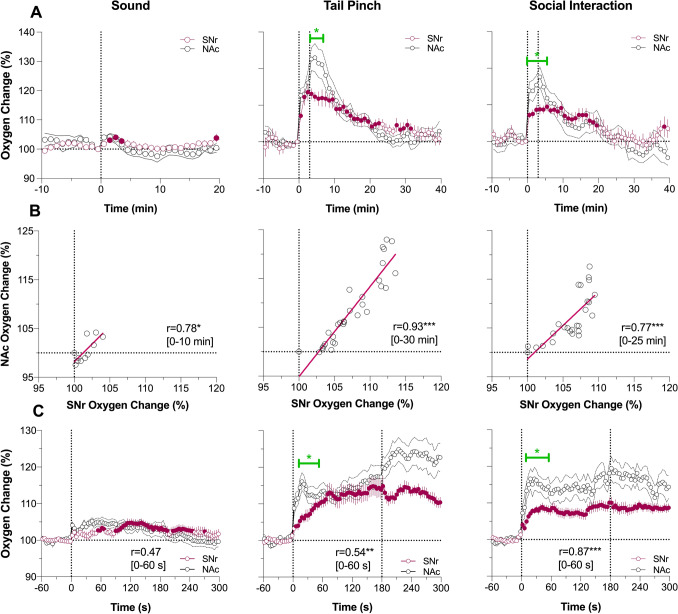
Figure 5.
Changes in oxygen levels in substantia nigra, pars reticulata (SNr) induced by auditory stimulus (Sound), Tail-pinch and Social Interaction in awake, freely moving rats. Comparison with nucleus accumbens (NAc) responses. (A) Mean (± SEM) changes in oxygen levels relative to baseline (100%) calculated with 1-min time bins. Vertical hatched lines show onset and offset of stimulus presentation. Filled symbols mark values significantly different from pre-stimulus baseline (P < 0.05). (B) Correlative relationships between oxygen changes in two recording locations. r = coefficient of correlation calculated for the time interval of significant increase in NAc oxygen levels (values in brackets). (C) Mean (± SEM) changes in oxygen levels relative to baseline (100%) calculated with 4-s time bins. SNr data were obtained in 4 rats; 12, 9 and 9 responses were averaged for cocaine and heroin at two doses, respectively) (see Supplementary materials for ANOVA values and n in each group). Asterisks show significance of coefficients of correlation (*, ** and ***, P < 0.05, P < 0.01 and 0.001, respectively). Green line with asterisk shows significant between-structure differences in oxygen curves for the initial period following stimulus presentation.

