Figure 5.
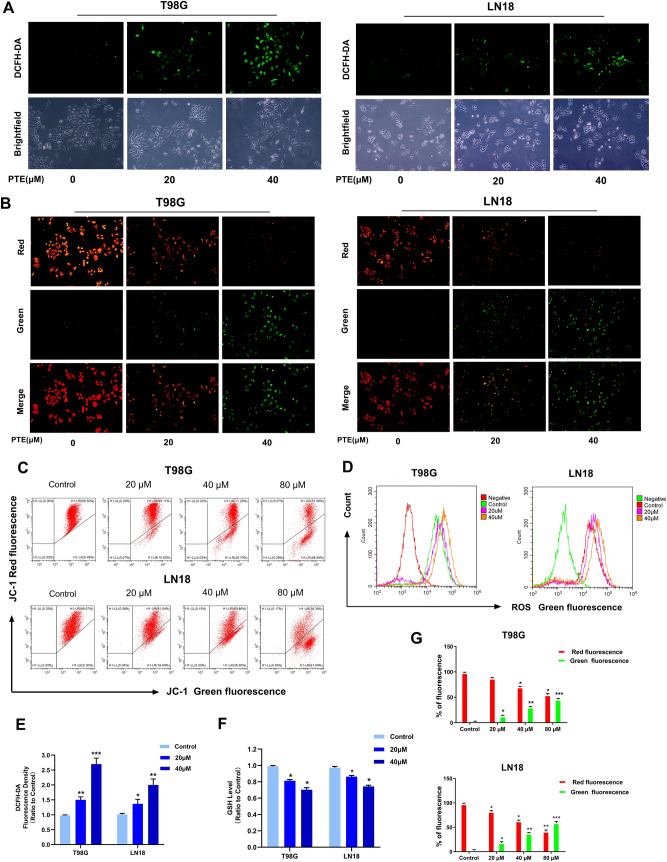
Pterostilbene induced overproduction of intracellular ROS in glioma cells. (A,D) T98G and LN18 cells were treated with PTE for 24 h. Cells were stained with 20 µM DCFH-DA at 37 °C in the dark for 20 min, and the ROS level was determined by fluorescence microscopy (10 ×) and flow cytometry. (B) Representative images of T98G and LN18 cells stained with JC-1 after treatment with PTE (20 and 40 µM) for 48 h, respectively, under a fluorescence microscope and a brightfield microscope (10 ×). (C,G) T98G and LN18 cells were treated with PTE for 48 h and the MMP was measured with the fluorescent mitochondrial probe JC-1 and analyzed by flow cytometry; Histogram showed the percentage of green positive cells and red negative cells in control and PTE treatment groups. (E) T98G and LN18 cells were treated with PTE for 24 h. Statistics analysis of the fluorescence intensity in the cells stained with DCFH-DA, which was read from a fluorescence spectrometer. (F) T98G and LN18 cells were treated with PTE for 24 h. Intracellular GSH level was measured by using the DTNB-GSSH reductase recycling assay kit. The GSH contents of cells were expressed as a ratio relative to the absorbance value of the control cells. Data are presented as the mean ± standard deviation (SD); n = 3; *p < 0.05, **p < 0.01 and ***p < 0.001, compared with the vehicle control group.

