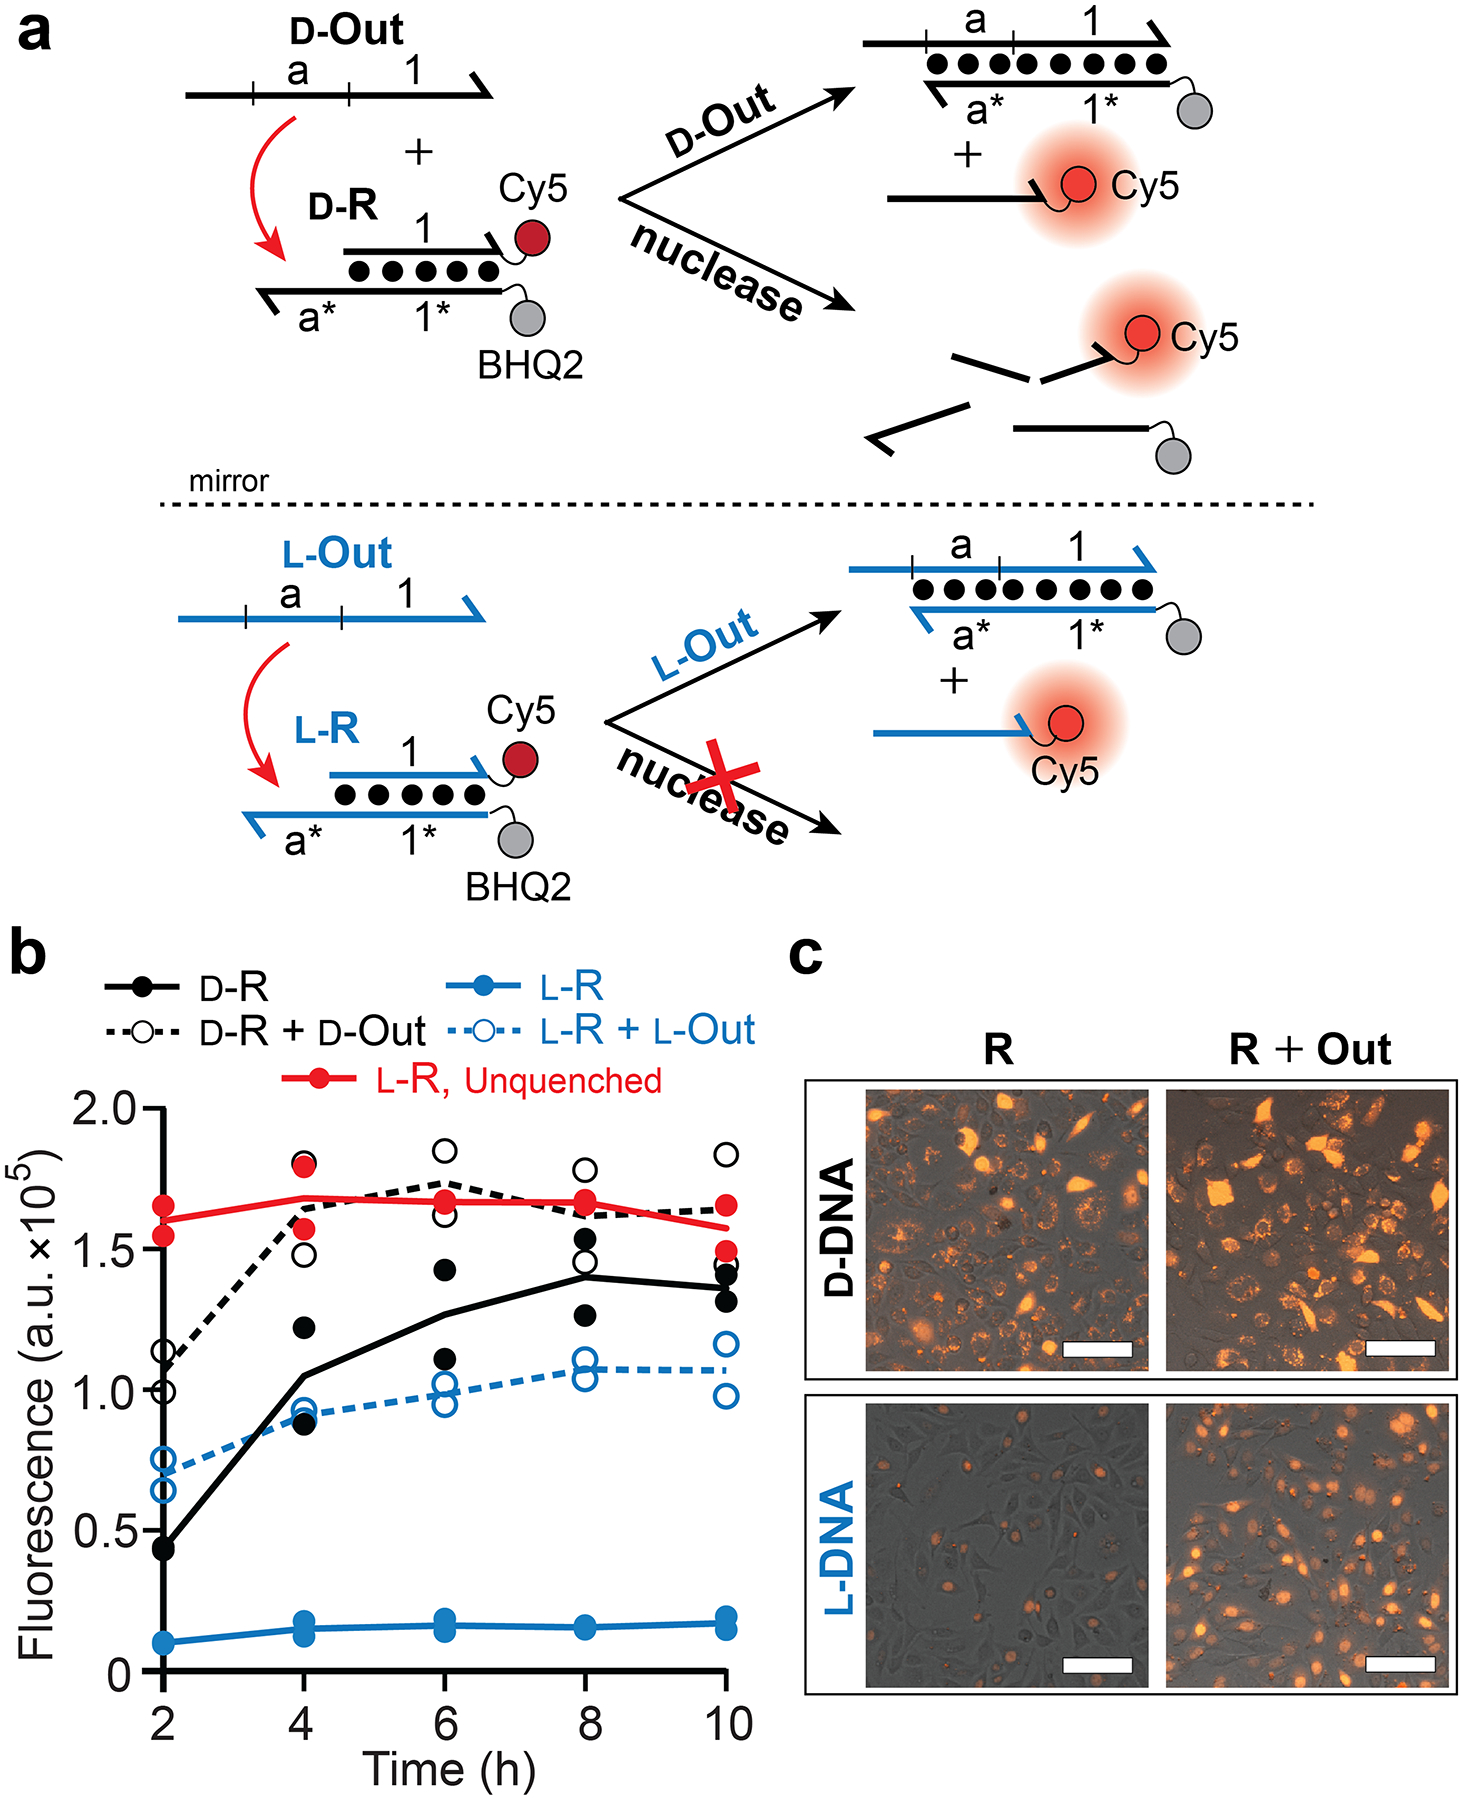
Figure 1.

Stability of d-DNA and l-DNA reporter complexes in live cells. (a) Schematic illustration of reporter complexes and their activation by specific and nonspecific pathways. d-DNA (black) and l-DNA (blue) are distinguished by color and are depicted as lines with the half arrow indicting the 3′ end. Sequences of all strands are listed in Table S1. (b) Fluorescent monitoring of reporter complexes in live cells by flow cytometry. Cells were transfected with the indicated components and the first measurement was acquired after 2 h. Red line indicates the unquenched l-DNA reporter control (Figure S3). Individual data points from at least two independent experiments are plotted and connected by the mean. (c) Representative fluorescent microscopy images of HeLa cells following 10 h incubation with the indicated components. Scale bars are 100 μm.
