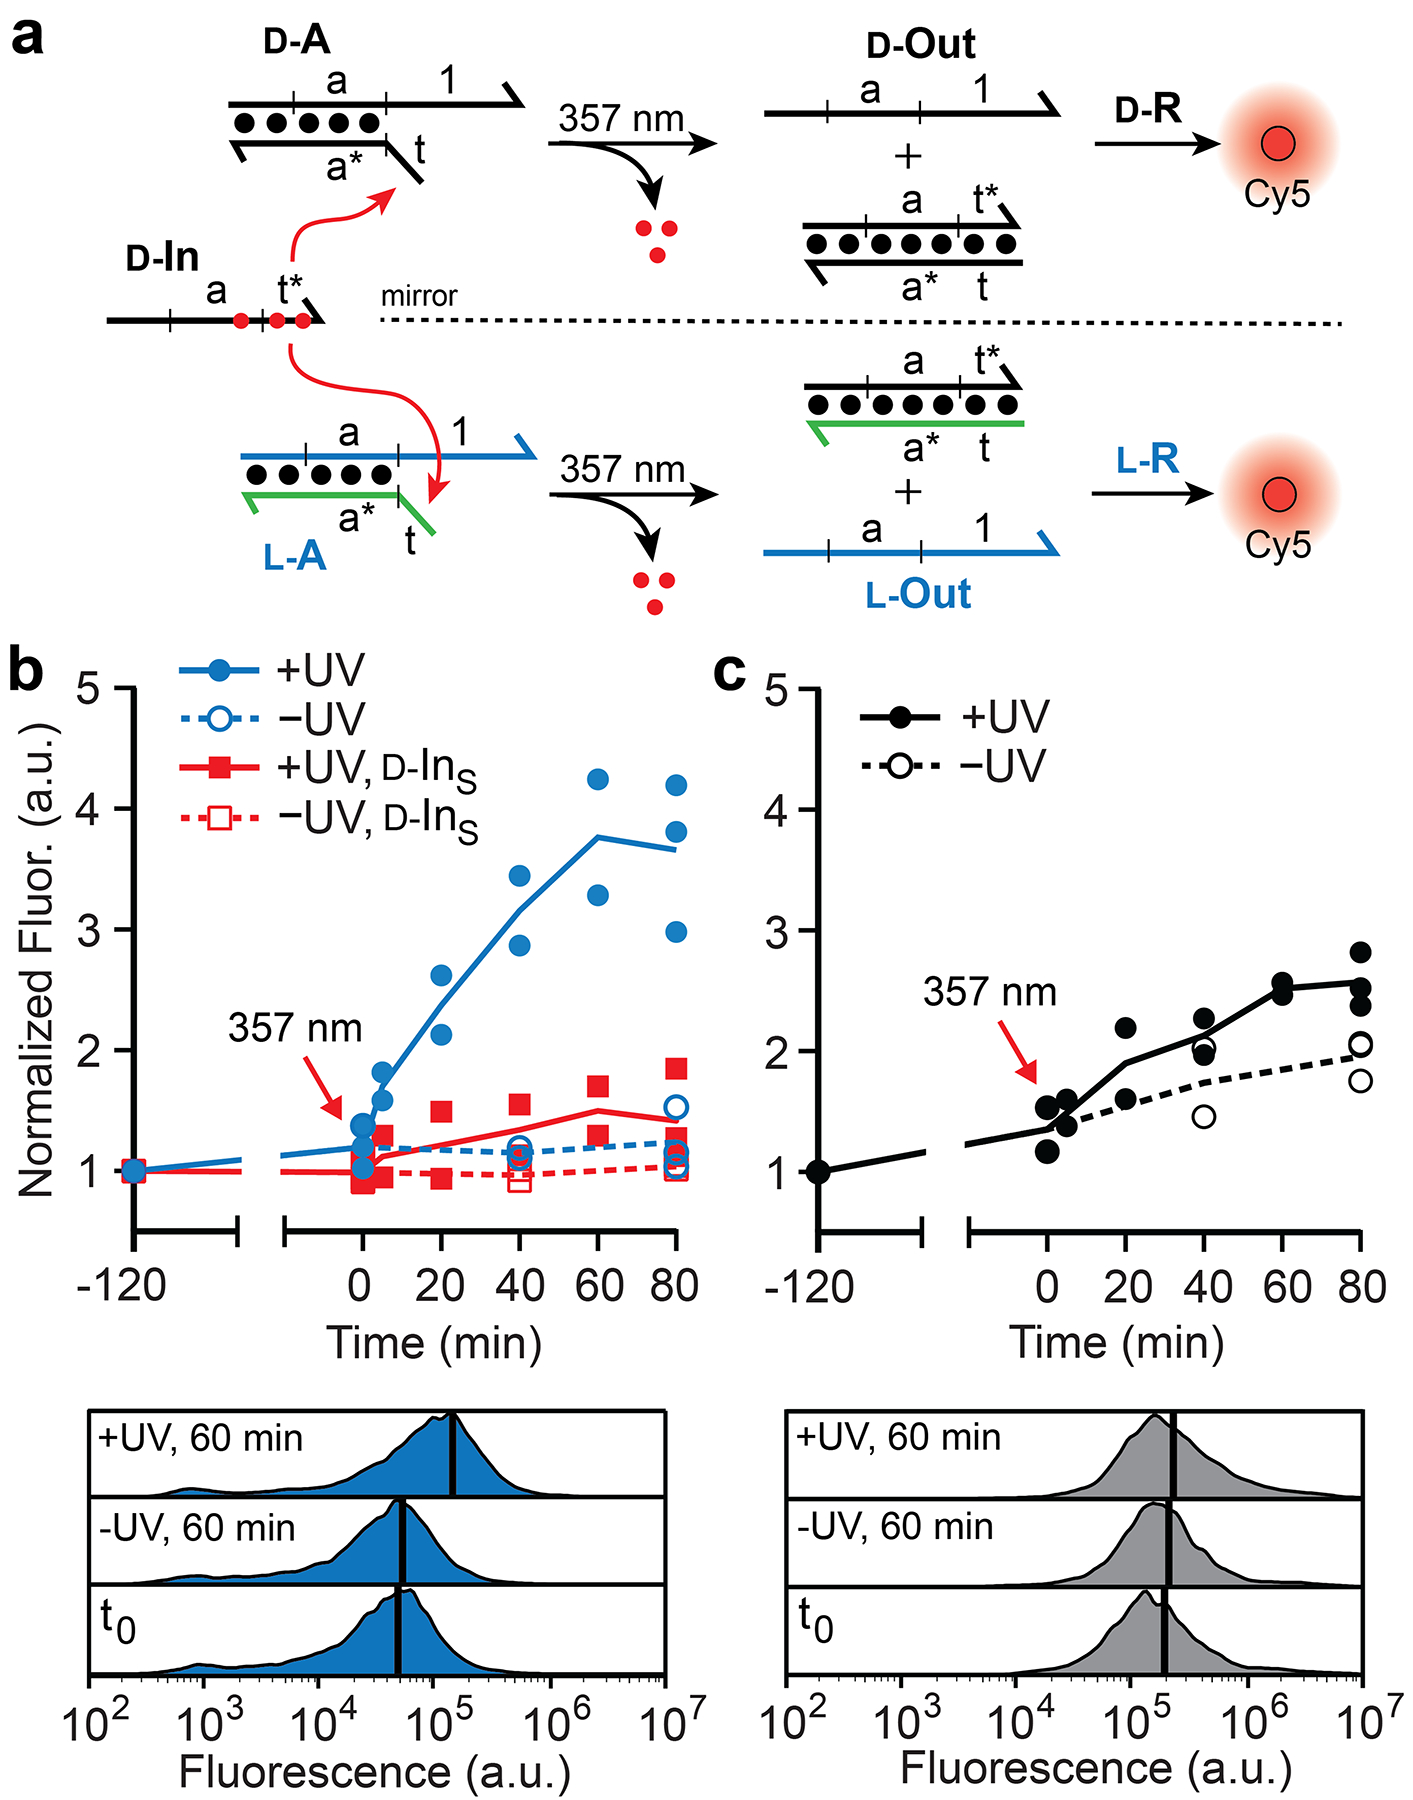
Figure 2.

Comparison of d-DNA and l-DNA strand-displacement cascades in living cells. (a) Schematic illustration of the strand-displacement cascade. The achiral PNA strand is shown in green (Figure S1). The N-POM (6-nitropiperonyloxymethylene) caging group on thymidine nucleotides is represented by red dots. (b,c) Fluorescent monitoring of strand-displacement cascades in living cells by flow cytometry. Cells were transfected with either l-DNA (b) or d-DNA (c) versions of the reaction components depicted in panel (a) and photolyzed 2 hours later (where indicated). d-INS (red) indicates a scrambled input. All signals were normalized to the initial fluorescence measurement (−120 min). Individual data points from at least two independent experiments are plotted and connected by the mean. Representative histograms (below) display cell count versus fluorescence (black line indicates the mean value).
