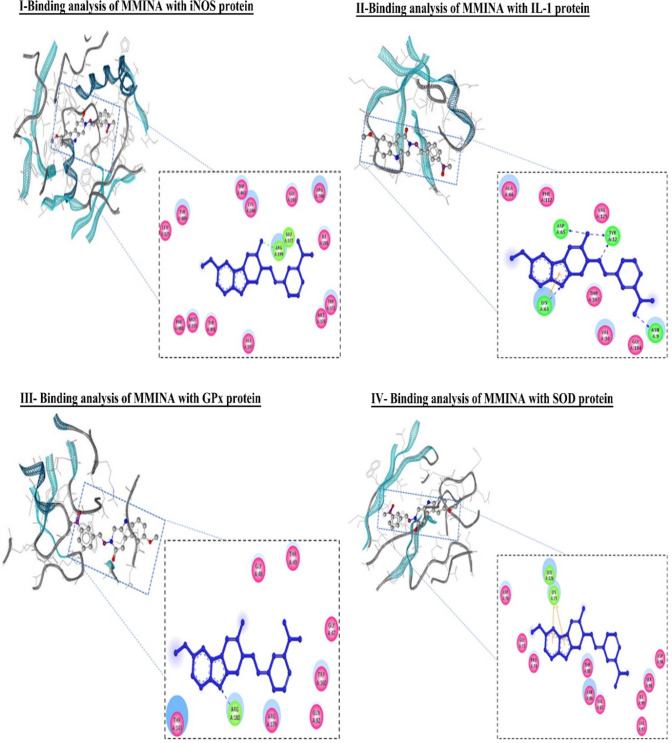
Figure 9.
Binding analysis of MMINA with iNOS, IL-1, GPX and SOD protein. In the 3D confirmation, protein is shown in snake ribbon while the MMINA is shown in grey ball and stick model. Blue ball and stick model represent the MMINA in 2D conformation, residues involved in hydrophobic interactions are shown in pink disc (hydrophobic interactions in GPx, while the residues involved in covalent and coordinate covalent interactions are shown in green disc (covalent in GPx, H-bond in IL-1). Orange colour line in IL-1 was indicating pi interactions.

