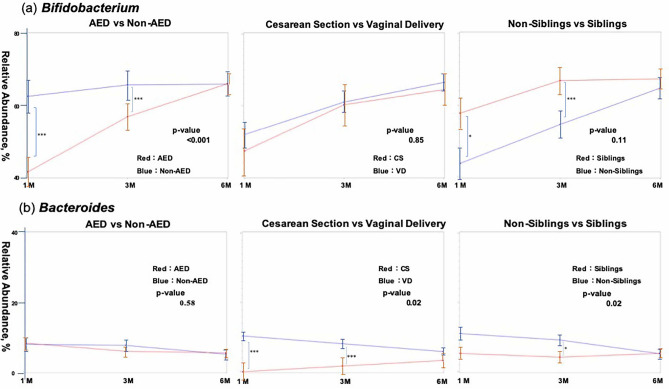
Figure 7.
Time-course changes in bifidobacterial (a) and Bacteroides (b) occupancies (from 1 to 6 months after birth) based on AED or non-AED, delivery method, and the presence or absence of siblings, using a linear mixed-effect model. The analysis set at 1 month included 130 infants. Dropouts at 3 and 6 months were handled as missing values. The standard deviation by age in months is shown in bar form in each figure. Significant differences in occupancies between the two groups at each time point are also indicated in each comparison. The significance level was set at 5%. *p < 0.05, ***p < 0.001 using the Mann–Whitney U-test. This figure was generated using SAS version 9.4 (https://www.sas.com).

