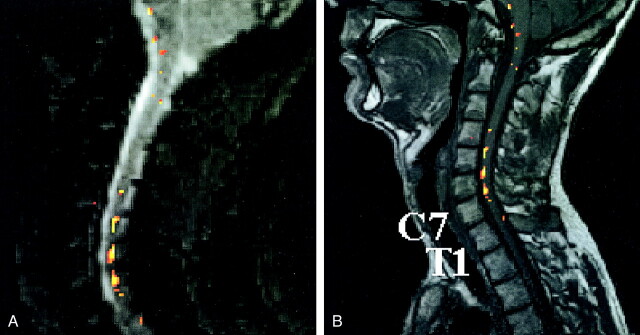
fig 3.
Example of a statistical parametric map obtained in an fMR imaging session with median nerve stimulation. Sagittal views of the statistical parametric maps of the fMR imaging responses superimposed on the first acquired T2*-weighted image (A) and the spatially corresponding anatomic T1-weighted image section (B). The voxels displayed in colors of the activation pattern analyzed with a statistical threshold of P < .01. Vertebrae C7 and T1 are indicated. The color bar indicates the statistical Z values

