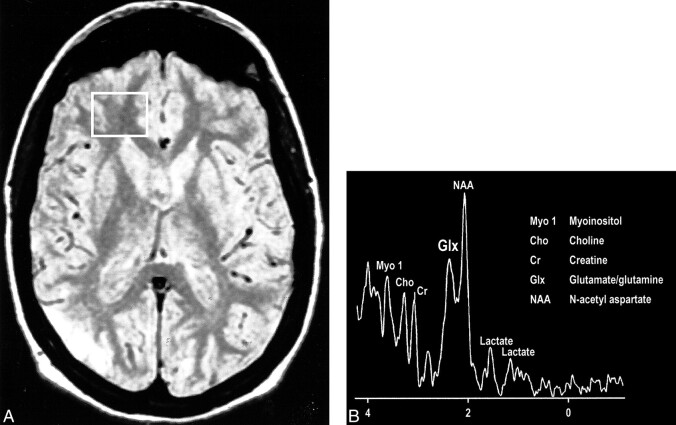
fig 18.
A, Proton-density–weighted MR image in a patient with MELAS shows bilateral abnormal signal intensity changes at the periphery of the occipital lobes.
B, MR spectrum obtained at 0.5 T shows elevated glx and lactate peaks from a sampling of the normal-appearing right frontal lobe of same patient (voxel placement indicated in A).

