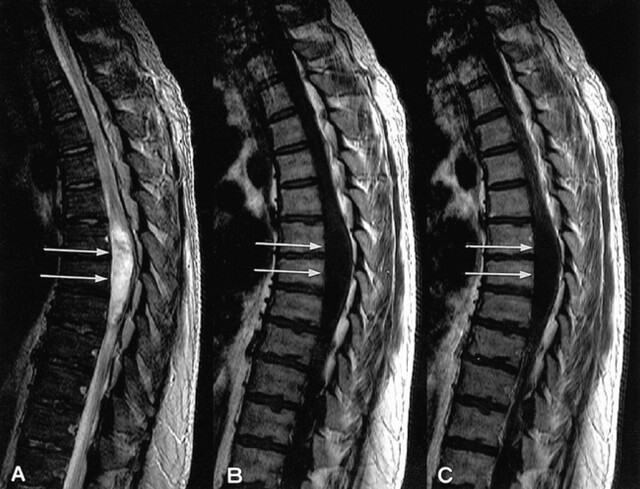
fig 1.
MR images of spinal epidermoid cyst (arrow).
A, Slightly inhomogeneous high signal intensity mass on T2-weighted image (2888/110/3) at the T5–T9 level.
B, Low signal intensity mass on T1-weighted image (350/12/3).
C, No contrast enhancement is seen on T1-weighted image obtained after the IV administration of contrast material.

