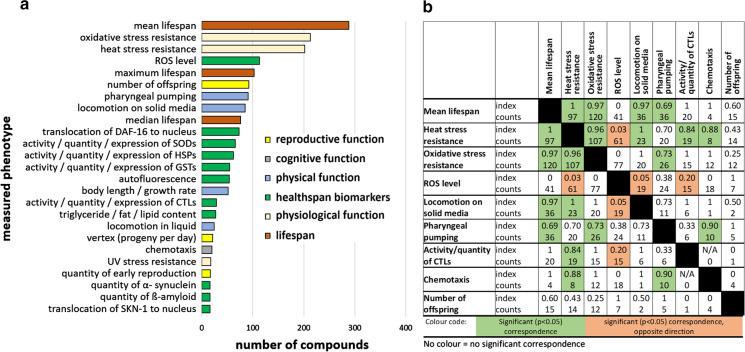
Fig. 2.
Analyzed phenotypes in C. elegans aging studies. The published phenotypes per compound were added up over all database entries. The phenotypes measured for at least 16 compounds are displayed (a). The color of the respective bars represents the allocation to one of the six phenotype groups as shown in the legend. Furthermore, the Jaccard similarity index between phenotypic measurements was calculated and a selection of the most used phenotypes and their correspondence with each other is shown (b). The counts represent statistically significant measurements and the index refers to the Jaccard similarity index. The significance of correspondence between two phenotypes was determined using the chi square test. Green colored cells indicate a significant (p < 0.05) correspondence between two phenotypes and a significant correspondence in opposite directions is marked red. Note: The Jaccard similarity index was already analyzed in January 2019, thus, excludes publications from 2019 and 2020

