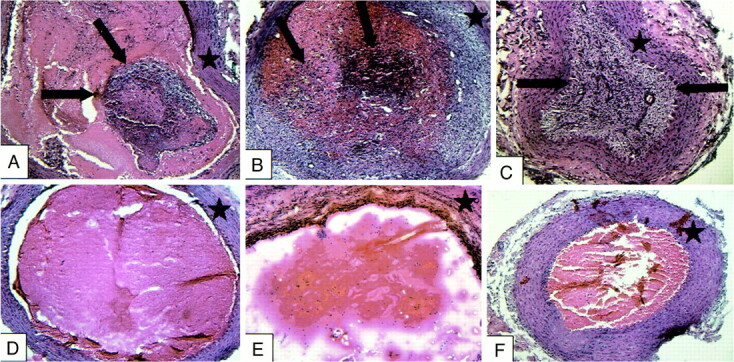
fig 7.

Treatment vessels containing implanted fibroblasts (A–C) and control vessels (D–F) at 3-day (A and D), 7-day (B and E), and 14-day (C and F) intervals. Treatment vessels show progressive intraluminal cellular proliferation and fibrosis (arrows). Control vessels are filled with unorganized thrombus with scant cellular infiltration. Star indicates vessel wall
