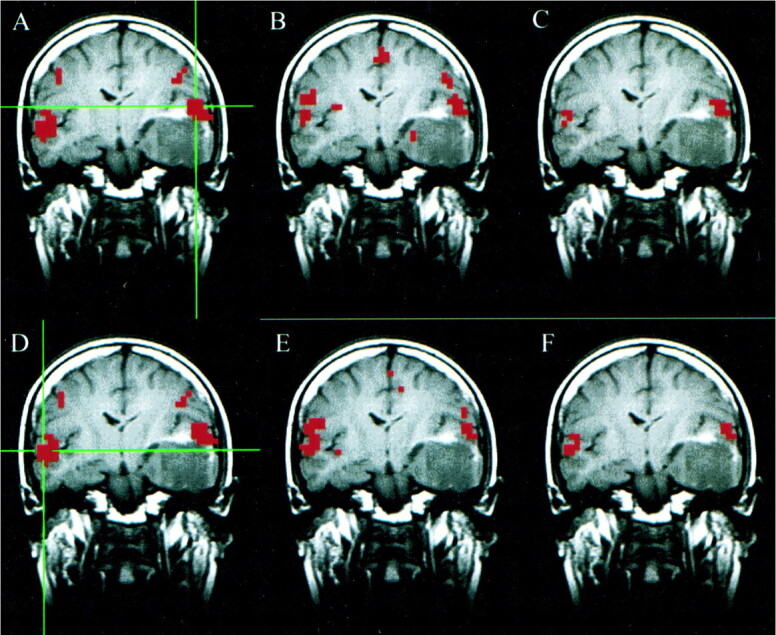
fig 1.

A–F, Coronal images in a patient with a left temporal oligodendroglioma. Student's t test, task-activation map for the auditory, text-listening paradigm (A and D) shows activation in the superior temporal gyri bilaterally. The functional connectivity map (B) based on a seed voxel in the left superior temporal gyrus (crosshairs in A) shows synchronous blood flow changes bilaterally in the superior temporal gyri. The intersect map (C) shows voxels that passed the thresholds in both the fMR (A) and fcMR (B) maps. It reflects a 33% concurrence ratio between the activation and connectivity analyses for this left hemisphere seed voxel. The functional connectivity map (E) based on a seed voxel in the right superior temporal gyrus (crosshairs in D) also shows synchronous blood flow changes bilaterally in the superior temporal gyri. The intersect map (F) reflects a 41% concurrence ratio between the activation map (D) and connectivity map (E) for this right hemisphere seed voxel
