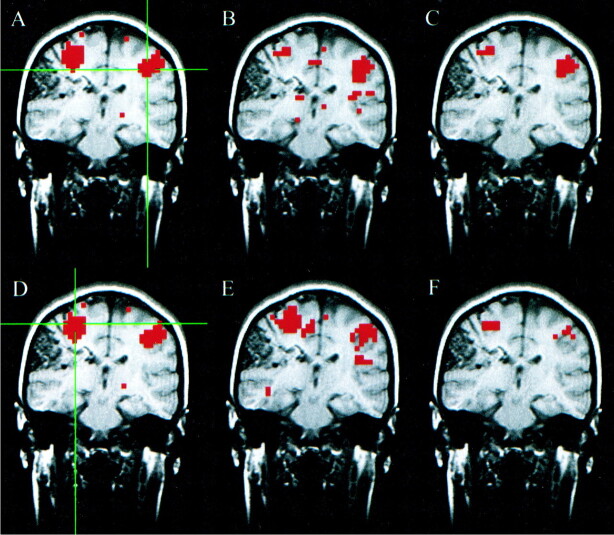
fig 2.
A–F, Coronal images in a patient with a right parasylvian arteriovenous malformation. Student's t test, task-activation map for the motor, finger-tapping paradigm (A and D) shows activation in the sensorimotor cortices bilaterally. The functional connectivity maps (B and E) based on seed voxels chosen from the left and right sensorimotor cortices (crosshairs in A and D, respectively) show synchronous blood flow changes bilaterally in the sensorimotor cortices. The intersect maps (C and F) show the voxels common to both the task-activation and functional connectivity maps. They reflect a 49% and 43% concurrence ratio between the activation and connectivity analyses for these left and right hemisphere seed voxels, respectively.

