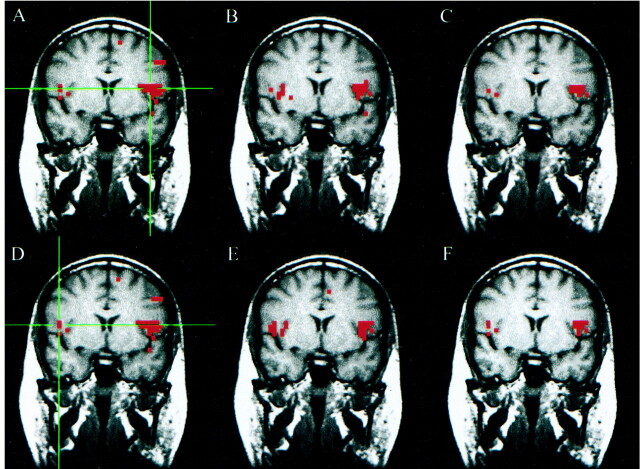
fig 3.
A–F, Coronal images in a patient with a left parietal cavernous angioma (not seen in this slice). Student's t test, task-activation map for the language, word-generation paradigm (A and D) shows activation in the left inferior and middle frontal gyri, and to a lesser extent in the right middle and inferior frontal gyri. The functional connectivity map (B) based on a seed voxel in the left inferior frontal gyrus (crosshairs in A) shows a pattern of connectivity in the left and right frontal lobes. The intersect map (C) shows voxels in both hemispheres passing the threshold in both the fMR and fcMR maps. It reflects a 51% concurrence ratio between activation and connectivity analyses for this left hemisphere seed voxel. The fMR (D), fcMR (E), and intersect (F) maps are shown for a seed voxel in the right inferior frontal gyrus (crosshairs in D). For this right hemisphere seed voxel, there was a 56% concurrence between the activation and connectivity maps. These data were not included in our tabulation because bilateral activation for language was not seen in all patients.

