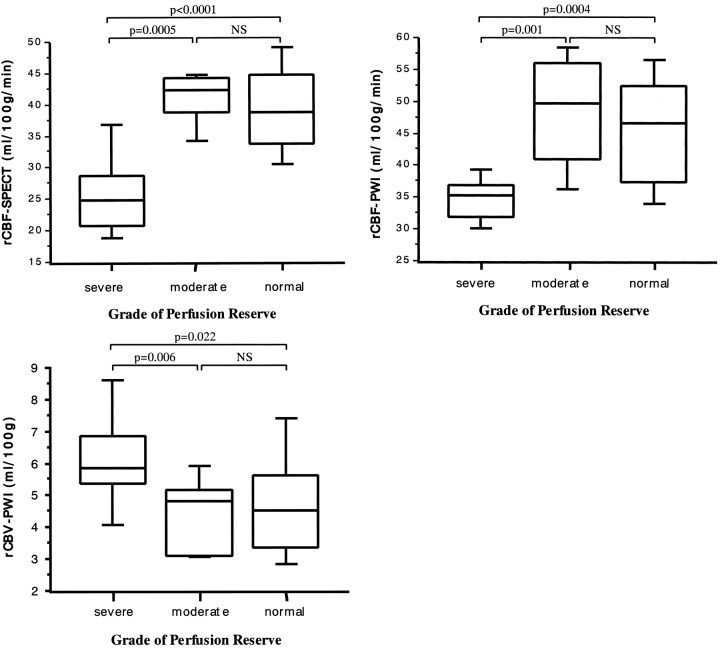
fig 4.
A–C, Box-and-whisker plot of rCBF-SPECT (A), rCBF-PWI (B), and rCBV-PWI (C) in the regions with severely decreased (% increase ≤ 0%), moderately decreased (0 < % increase ≤ 15%), and normal (15% < % increase) perfusion reserve. % increase was defined as [(post-rCBF) − (pre-rCBF)]/(pre-rCBF) × 100, where pre-rCBF and post-rCBF denote the CBF values before and after acetazolamide CBF as measured on 133Xe-SPECT scans, respectively. Boxes represent 25% to 70% range with bisecting lines showing medium values; horizontal lines represent 10% to 90% range; NS indicates not significant. Note that the regions with severely decreased perfusion reserve show significantly lower rCBF values on 133Xe-SPECT (A) and rCBF-PWI (B) studies than do those with moderately decreased or normal perfusion reserve. They also show significantly higher rCBV values on rCBV-PWI study (C) than do those with moderately decreased or normal perfusion reserve.

