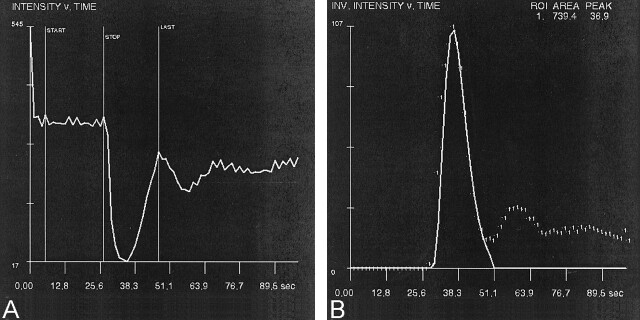
Fig 1.
Signal intensity versus time.
A, Mean signal intensity as a function of time from an ROI placed within the proximal intracranial branch of the MCA. The start-stop interval is used to define the mean baseline signal intensity, while the stop-last interval represents the first pass of the contrast bolus. Note that subsequent decreases in signal intensity occur as the contrast material is recirculated.
B, Gamma-variate fit (solid line) to the baseline subtracted and inverted data (dashed line). The two variables used to quantify the curve are the first moment of the gamma-variate fit, termed the first-moment transit time (TTFM), and the area under the fitted curve (relative cerebral blood volume [rCBV]).

