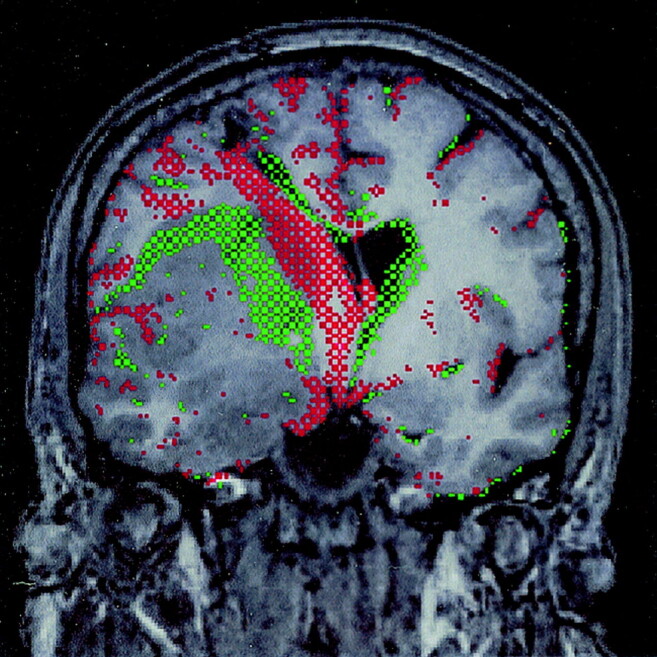
Fig 3.

Difference image of volumetric pre- and post-treatment studies. Red-green difference image of pre- and post-treatment coregistered nonenhanced T1-weighted volumetric images (14.4/ 6.4/1[TR/TE/NEX]) with a section thickness of 1 mm. Green indicates a shift from lower to higher signal intensity between the first and second study; red, the reverse. Reduction in size of the superior (mostly insular) tumor component is shown in green, which indicates replacement of T1-hypointense tumor by tissue of higher signal intensity. Re-expansion of the hypointense CSF spaces because of a decrease in mass effect is indicated in red (this includes a track leading down to the right lateral ventricle, which is related to a previous biopsy). Note the absence of boundary shifts of the temporal tumor component between the pre- and post-treatment studies.
