Fig 1.
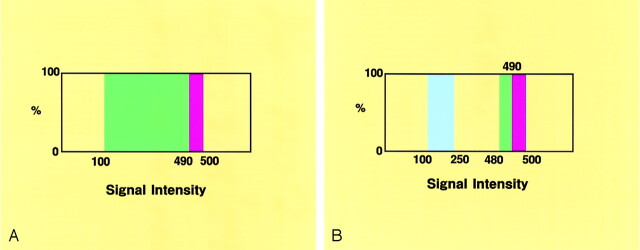
Opacity charts of the signal intensity distribution for the 3D MR cisternograms.
A, Opacity chart for the conventional 3D MR cisternogram, showing a square curve with a threshold range of 100–500 (100% opacity level), and color-rendered in green (threshold range 100–490) and red (490–500).
B, Opacity chart for the transparent 3D MR cisternogram, showing square curves, one with a threshold range of 480–500 (100% opacity level), color-rendered in green (threshold range 480–490) and red (490–500), and the other with a threshold range of 100–250 (100% opacity level), color-rendered in blue.

