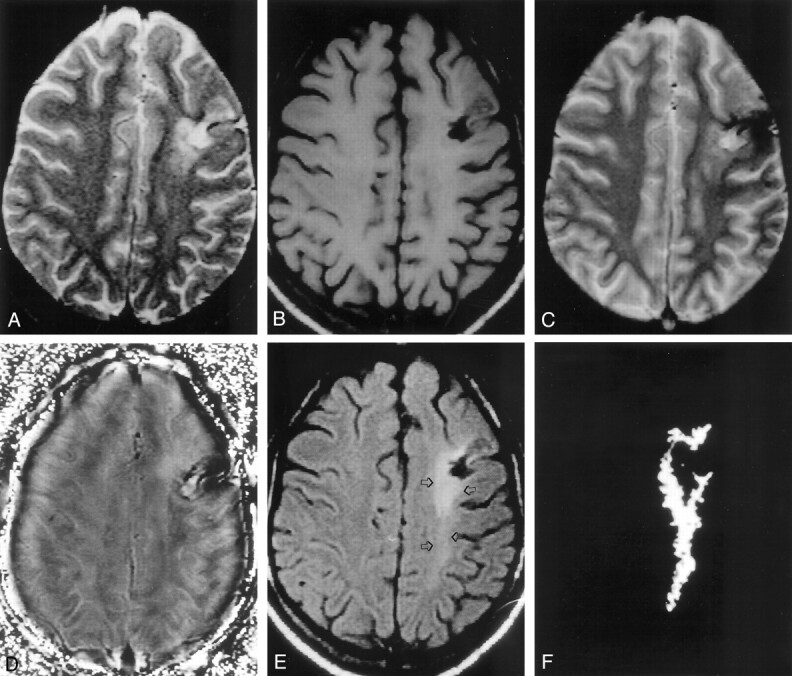
Fig 2.

MT abnormality beyond the abnormality seen on the T2-weighted image, in a patient with intractable PTE.
A, Axial T2-weighted image through the supraventricular region shows mixed hyperintensity in the left frontal region.
B, Corresponding T1-weighted image shows variable hypointensity in the left frontal region.
C, T2*-weighted image shows hypointensity associated with blooming, which confirms hemosiderin deposit in that region.
D, Corresponding phase-corrected GRE image shows negative signal intensity around the lesion, consistent with focal hemosiderin deposit.
E, T1-weighted MT image shows a hypointense cavity surrounded by an area of hyperintensity that extends to the left parietal region (arrows), suggestive of gliosis.
F, Difference of segmentation of the abnormality seen in A and E confirms the extension of hyperintensity beyond the T2 abnormality.
