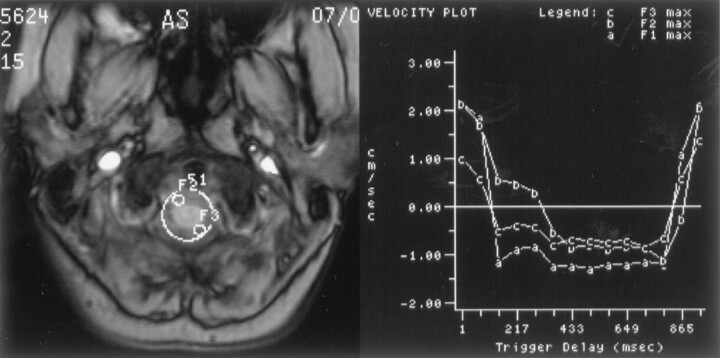
Fig 3.
Image of the foramen magnum in a normal volunteer shows the placement of three regions of interest (left) and maximal velocities displayed graphically over time (right) for each of the regions of interest. One of the regions of interest encompasses the entire subarachnoid space, and two smaller regions of interest sample portions of the subarachnoid space. Flow in each region of interest has similar temporal patterns and magnitudes. Systolic flow is evident from trigger delays of approximately 160 ms to approximately 860 ms in each of the regions of interest.

