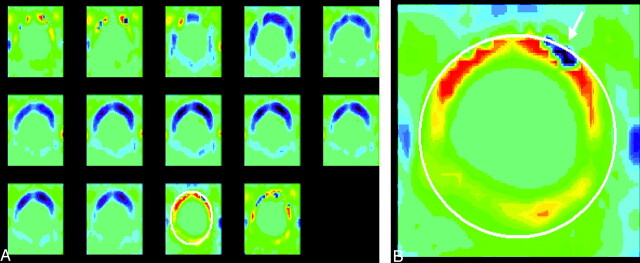
Fig 5.
Phase contrast images throughout the cardiac cycle in a patient (A) show inhomogeneous flow. These show inhomogeneity of flow, greater velocities anterior to the cord than posterior, greater velocities paramidline than in the midline and greater velocities in the craniad direction than in the caudad direction. An oval is placed on one image with a long trigger delay obtained during diastolic flow of CSF. An enlargement of that image (B) shows a region of aliasing (arrow) within the subarachnoid space in which flow velocity exceeded the venc.

