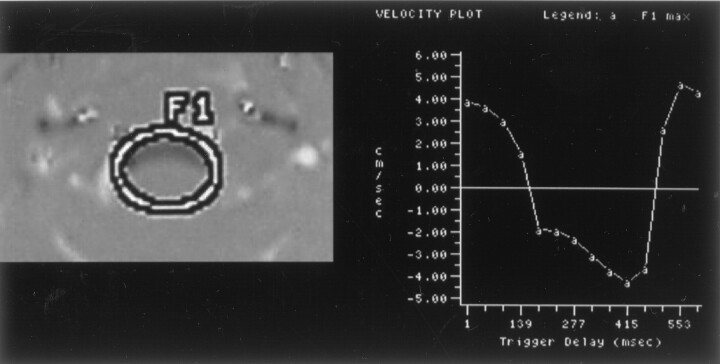
Fig 6.
Phase-contrast image (left) of the foramen magnum shows the placement of a region of interest. Graph of the maximal velocities (right) throughout the cardiac cycle in the selected region of interest in a patient with a Chiari I malformation and a syrinx. Peak velocities during systole and diastole are 4.8 cm/s.

