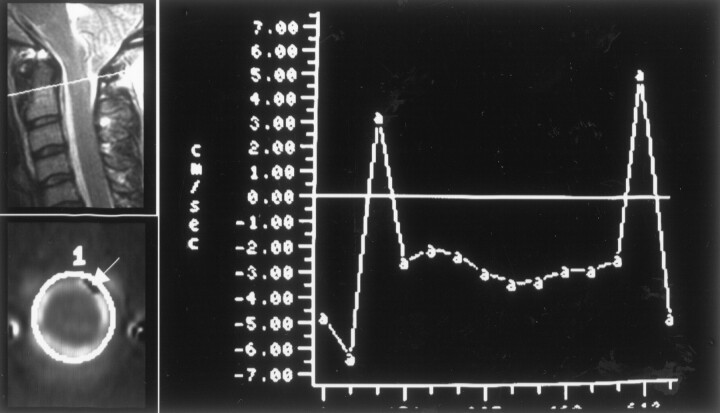
Fig 8.
Illustration of aliasing of craniad flow in a patient. In a sagittal view image (upper left), the location of the axial plane is indicated by a white line. In an axial view image showing craniad flow at 51-ms trigger delay (lower left), the location of a region of interest is illustrated. An arrow in this image obtained during the first 50 ms of the cardiac cycle indicates a region of inverted sign. In the graph of CSF velocity, flow paradoxically has a negative sign during the first 50 and last 50 ms of the cardiac cycle, indicating aliasing during diastole.

