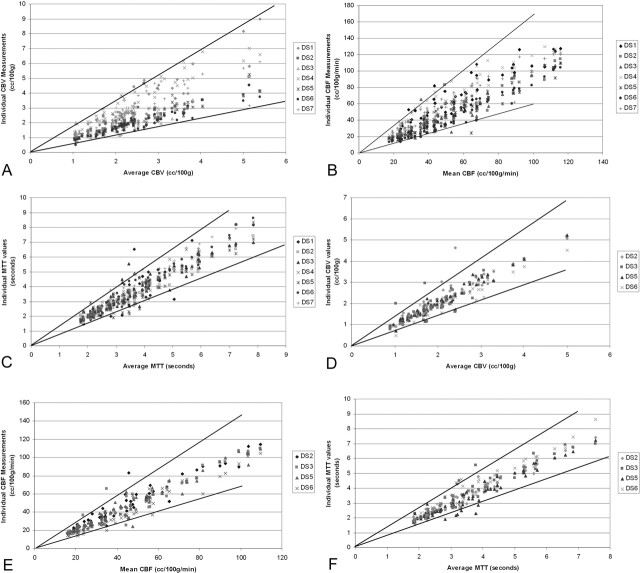
Fig 4.
Distribution of the individual parenchymal region of interest values derived from (A) CBV, (B) CBF, and (C) MTT maps as a function of the average value for each corresponding parenchymal region of interest. Ninety-five percent confidence intervals (solid lines) are defined by the squares of the geometric standard deviations for the data sets. The confidence intervals define the range of measurements that would be expected for a given “true value.” If the data generated by CTT 1 are excluded from the analysis (see Results), the 95% confidence intervals are improved substantially for the (D) CBV and (E) CBF data, with little change in the variability of (F) MTT.

