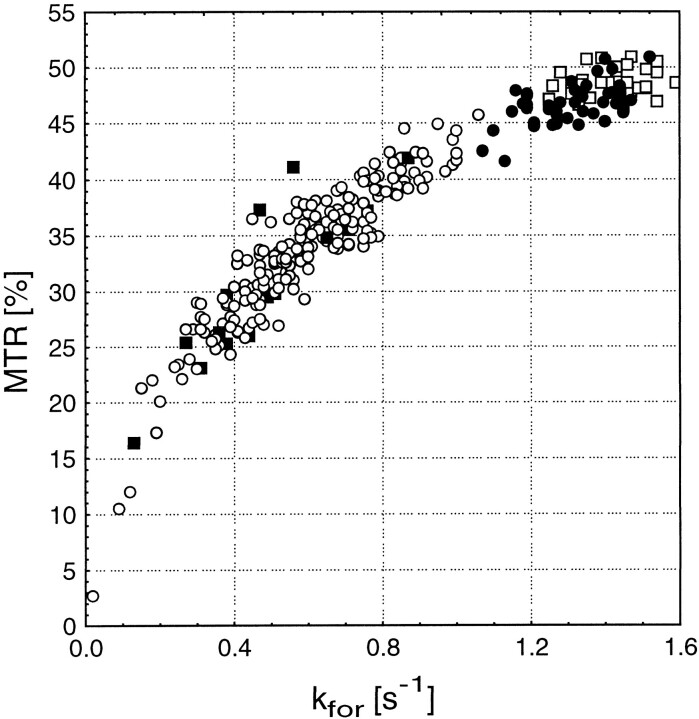
fig 5.
MTR versus kfor for different lesion types. The open squares show NWM. The filled circles show areas with diffuse changes. Non- active lesions are represented by the open circles, and active lesions are represented by the filled squares. The clustered groups show a good correlation between MTR and kfor; however, the overall relationship is non-linear

