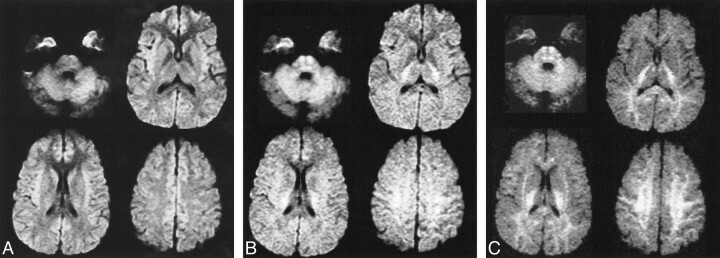
fig 1.
Isotropic diffusion-weighted images with varying b values.
A, Image obtained with a b value of 1000 and 72/1 (TE/excitations). There is hyperintensity of cortical gray matter, particularly in the insular and medial frontal regions.
B, Image obtained with a b value of 2000 and 84/2. Near isointensity of gray and white matter is seen with slight hyperintensity of posterior capsular white matter and pontine regions.
C, Image obtained with a b value of 3500 and 96/4. Progressive hyperintensity of white matter is present with diminished gray matter signal intensity.

