
fig 1.
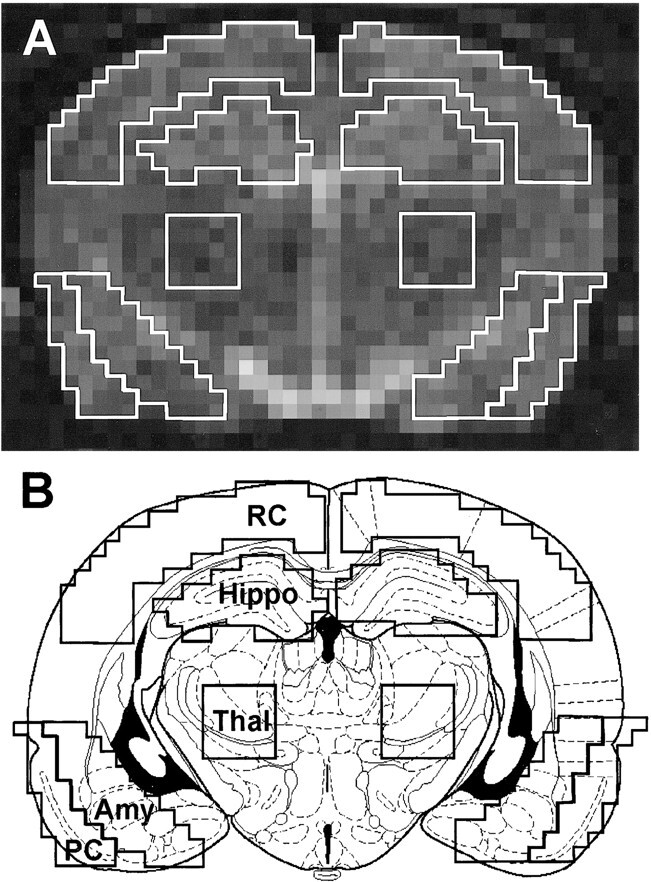
ROIs used for quantitative analysis. A, Representative control image on which ROIs were outlined using Chesire image processing software. B, Schematic drawing of a rat brain at similar level with the identical ROIs superimposed, illustrating the accuracy of our ROIs. ROIs were defined as: retrosplenial cortex (RC), hippocampus (Hippo), thalamus (Thal), amygdala (Amy), piriform cortex (PC)