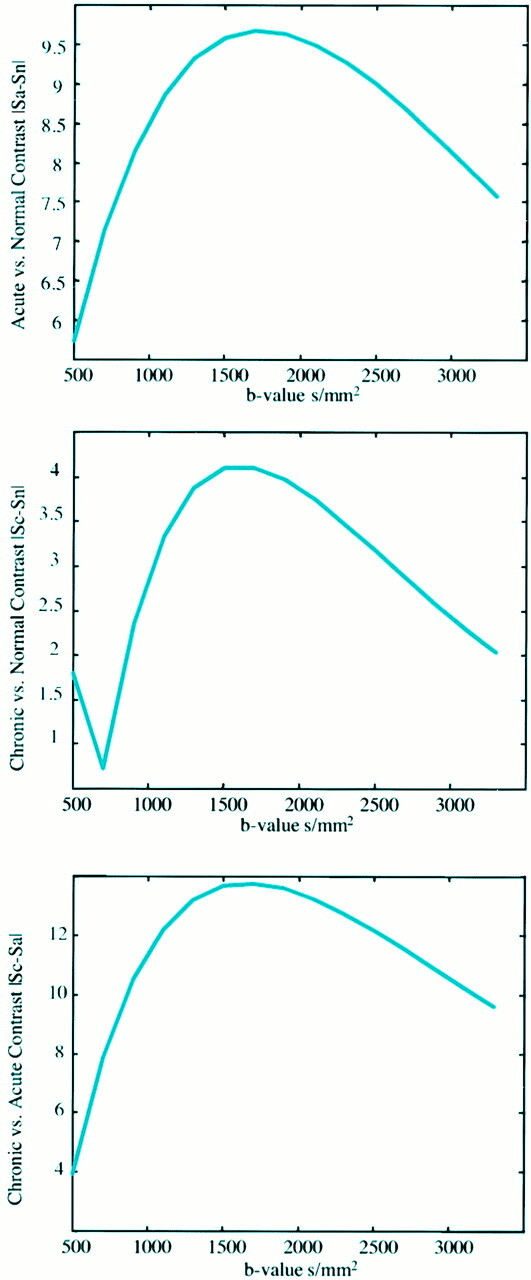
fig 1.

The signal intensity difference between three tissue types (normal gray matter tissue [assumed ADC = 0.8 × 10⁻³ mm2/s, T2 = 100 ms], acute ischemic tissue [decreased ADC = 0.4 × 10⁻³ mm2/s, T2 = 100 ms], and chronic lesions [elevated ADC = 1.3 × 10⁻³ mm2/s, elevated T2 = 100 ms]) plotted as a function of the b value. In addition to the ADC and T2 assumptions for each tissue, the tissue T1s were assumed to be equal (1000 ms) and significantly smaller than the imaging TR (10 s) such that T1 effects could be ignored.
A, The signal difference in normal gray matter tissue and acute lesion is shown.
B, Normal tissue signal is compared with chronic lesion signal, assuming the T2 and ADC are elevated in the chronic lesion.
C, The relative signal difference between acute and chronic lesion signal is demonstrated. In each case, the contrast reaches a maximum in the b-value range of 1500–2000 s/mm2. Note, however, that the largest contrast is seen in C (acute vs chronic), suggesting that higher b values may be beneficial in delineating chronically infarcted versus acutely ischemic regions.
